
Last year, we published our predictions about what CIOs can expect from their service desks over the next five years. We explored the impact of recent advances in technology on the service desk. Data at the time showed contact numbers were on a downward trend – and we predicted that they would continue to decrease. The adoption of self-service portals, automation, data repositories, and analyzing tools means that many users are solving their own problems – resetting passwords, for example, and answering questions for which they once had to open a service desk ticket. Everyone agrees, fewer contacts per user per year for the service desk is a good sign.
We also predicted a gradual drop in first-level resolution (FLR) starting in 2021, along with a steady rise in customer satisfaction as cases are resolved more quickly. Until now, FLR has been an important metric – one that was depended on more than others to gauge the success of the service desk. If the FLR was going up, the service desk was heading in the right direction. So, what does it mean if FLR is going down?
Why service desk contacts are reducing
When the most recent service desk data came in, it validated our predictions. The data show that between 2019 and 2020, the number of contacts at the service desk did, in fact, continue to go down. The number of contacts per year went from an average of 9.3 per user in 2019 to an average of 6.3 per user in 2020. That is a decrease of almost a third in the span of one year.
As self-serve portals and automation make their way into companies, users rely on the service desk less and less frequently. This trend is supported by a change in user behavior. Millennial customers, for example, often prefer to find their own solutions rather than call the service desk for help. Couple this with improved process efficiency at the service desk made possible by robotic process automation (RPA) and improved knowledge bases, and many companies are reporting greater customer satisfaction.
Why first-level resolution is going down
All of this is good news to be sure – it means more and more service desks are finding success. But it also has implications for how we think about and measure success at the service desk going forward.
Robotic process automation (RPA), chatbots, artificial intelligence (AI), and other rapidly maturing technologies are lowering the number of cases that require service desk attention. This is opening the door for forward-thinking managers to embrace automation, trim budgets, and free up resources for other IT projects. As companies increasingly adopt automation that can handle more complex tasks at the first level, they are recognizing the need to rebalance their reliance on metrics like FLR, response time, and abandonment rates when evaluating the service desk.
To date, first-level resolution (FLR) has been the gold standard for measuring service desk efficiency. When more tickets are resolved on the first level, fewer contacts are escalated to higher-expense resources. This means many more tickets are resolved for $12 - $25 – or even $0 - $10 – instead of being escalated to L2 or L3 analysts where the solution might cost $75 - $600.
But now we are moving into a new era, in which relying on FLR rates is insufficient. As automation takes over more mundane tasks, FLR rates will fall – even in the most efficient of service desks. It simply means more problems are handled before they get to the service desk, and the service desk gets only the most challenging of issues.
This trend has already begun. Reports show FLR rate of 76% in 2019 and a reduced FLR rate of 71% in 2020. This means the service desk is resolving fewer issues, but it does not necessarily mean that service desk efficiency is dropping. It is an indication that the less complex issues are being resolved through automation, self-service, and self-help before they get to the service desk, leaving the more complex issues for service desk analysts.
Improving customer satisfaction at the service desk
At CAI, we help organizations improve their customer satisfaction at the service desk by “shifting left." In most cases, we think of moving right as the direction of progress. But in the world of the IT service desk, “shifting left” is the correct direction. Shifting left is the concept of driving issue and service request resolution to the lowest cost resource – Level II to Level I, Level I to self-service, and elimination of some issues through root cause analysis.
A better customer experience is made up of two things: the customer’s ability to address and/or resolve their own issues and the service desk’s ability to handle more complex issues without escalation. Better customer experience translates to higher customer satisfaction.
Measuring the service desk of the future
To help service desks pivot toward the future and accurately measure their efficiency, CAI has developed the Shift Left Index, which is already in use by some clients.
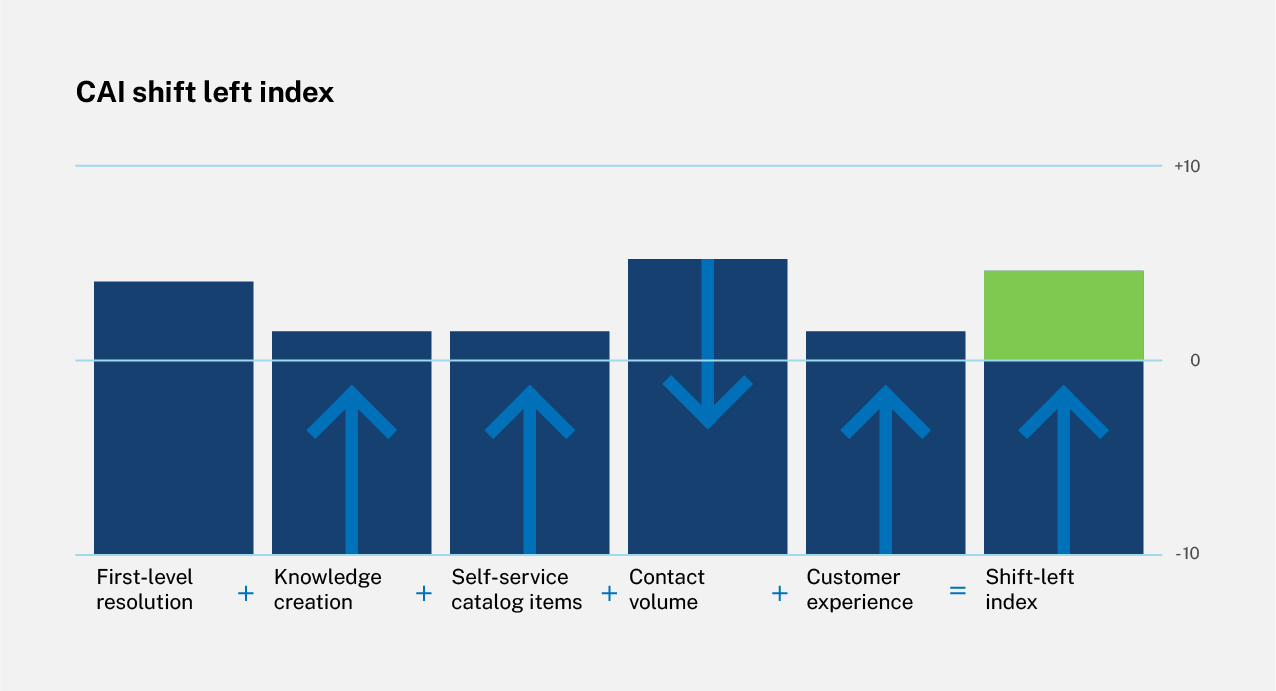
The CAI Shift Left Index calculates five key data points: FLR, knowledge creation, self-service catalog items, contact volume, and customer satisfaction. The Index runs on a scale from minus 10 to plus 10 to reflect the maturity and productivity of the existing service desk. The chart below shows progress over time for a CAI client working to address certain service desks. Trend lines are normally a straight line as seen in the graphic below.
With the CAI Shift Left Index, a service desk can more accurately determine where it is meeting its goals, how its investments are paying off, and where it can improve. The CAI service desk shift left methodology is simple: carefully document resolutions, train service desk operators to think systematically, embrace self-help, automate, and then measure, measure, measure. It is the only way service desks can understand the trajectory of their service desk journey.
Expectations for the service desk are changing quickly – and CIOs and service desk managers must measure success differently moving forward.