

Introduction
Not long ago, it seemed a service desk could satisfy its customers if a friendly voice answered the phone promptly and assigned the case to a competent analyst.
Today, game-changing advances in technologies, a new generation of end-users, rising labor costs, and shifting metrics demand that CIOs reconsider how they measure their success. Robotic Process Automation (RPA), chatbots, artificial intelligence (AI), and other rapidly maturing technologies have already lowered the number of cases that require service desk attention, opening the door for forward-thinking managers to trim budgets, free-up resources for other IT projects, and resolve more cases.
CAI explored the quickly changing landscape of the service desk to draw a clear roadmap of where we are today, the benefits of “shifting left,” and what we can expect in the future.
Part 1
What is Service Desk at present?
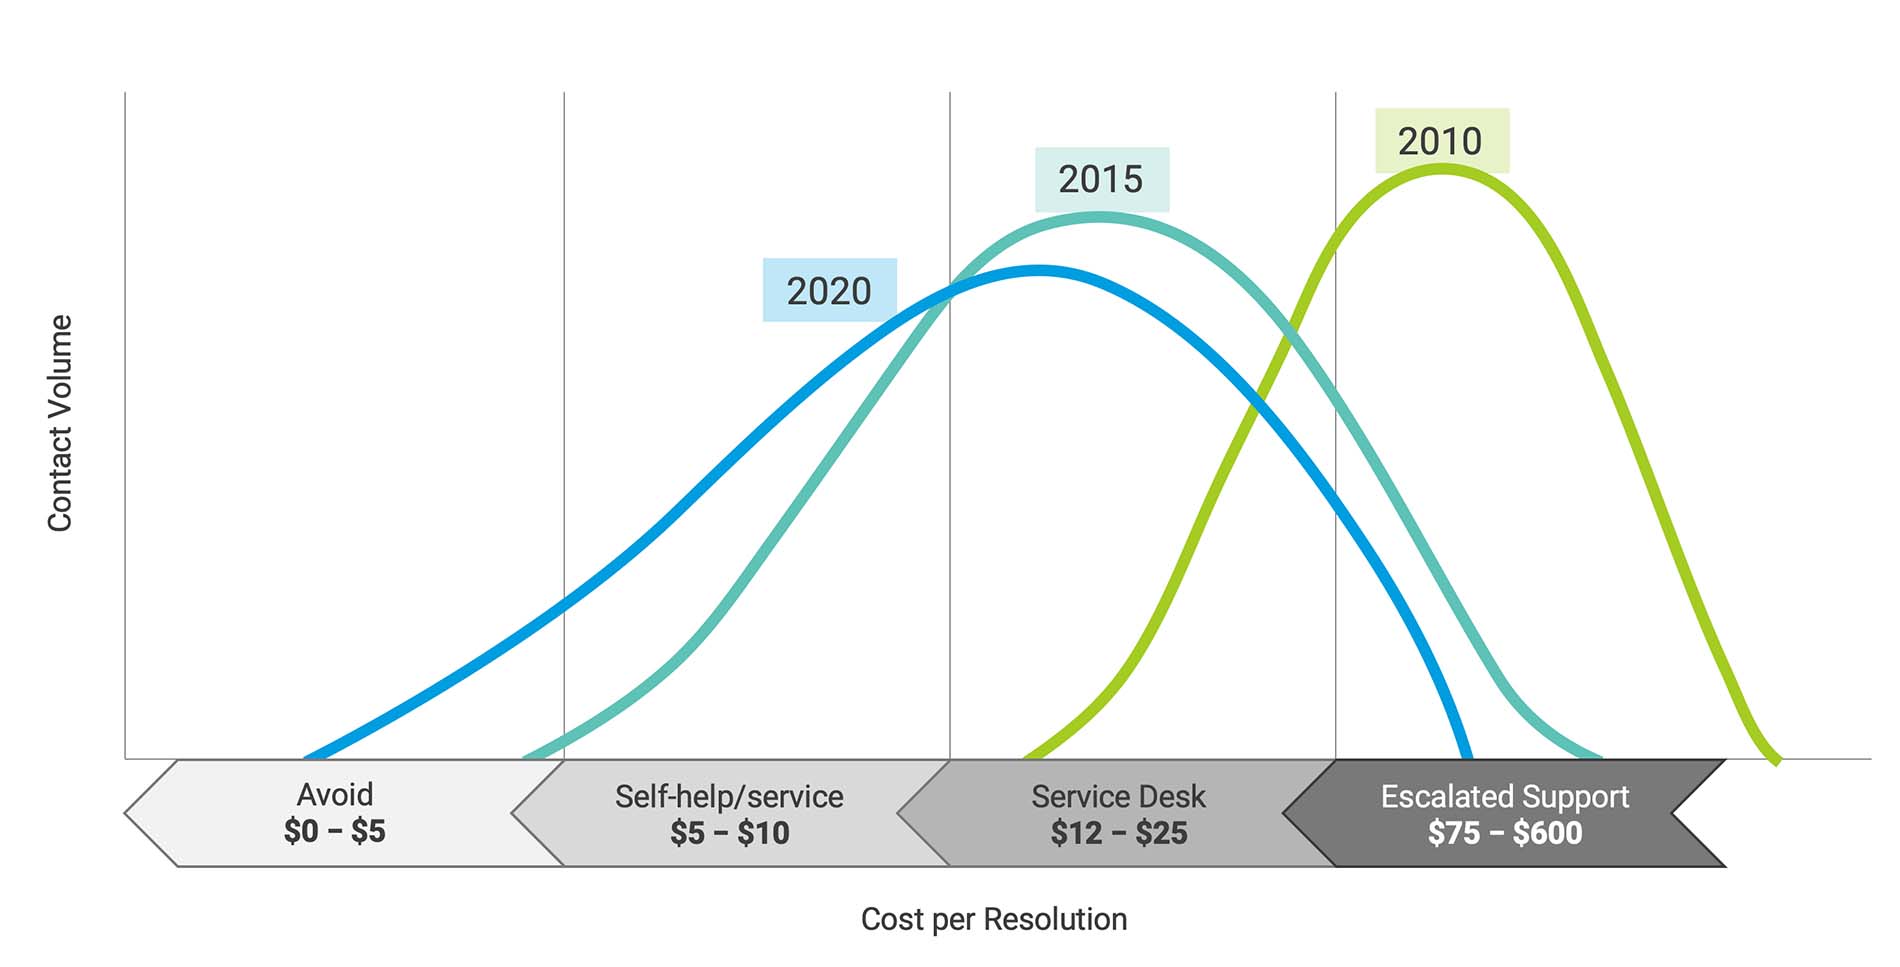
The evolution of the service desk reveals itself on a curve that contrasts the volume of contacts with the cost of resolution. Avoiding any contact, of course, costs the least while escalating the ticket drives the cost higher. Over the last decade, the peak of that curve shifted to the left, reflecting a lower cost of resolution. This is one of several metrics that reflect the impact of new service desk technologies.
According to research from several sources, first-level resolution (FLR) rates sat at 64% in 2017, jumped to 71% in 2018, and improved again to 74% by 2019—a 10% increase in two years. Today, four out of five contacts are answered in less than 30 seconds, and customer satisfaction hovers at 82%.
At the same time, the cost per contact (CPC) rose sharply, from an average of $15.83 in 2018 to $19.80 one year later, reflecting both the skill sets required to resolve calls and a shortage of qualified workers.
CPC also varies with company size. A smaller service desk with less than 80,000 contacts per year may have a CPC above $20, while a desk with over 275,000 annual contacts will pay as little as $13.
Service desk managers can (and should) calculate their CPC by adding all their annual service desk costs – labor, equipment, licenses, training, facilities, etc. – and dividing that by the number of annual contacts. Typical service desk operations account for just 5.9% of a CIO’s annual budget, suggesting the key driver for improving the service desk is to increase customer satisfaction rather than to reduce costs.
Part 2
What is the Service Desk outlook for 2025?
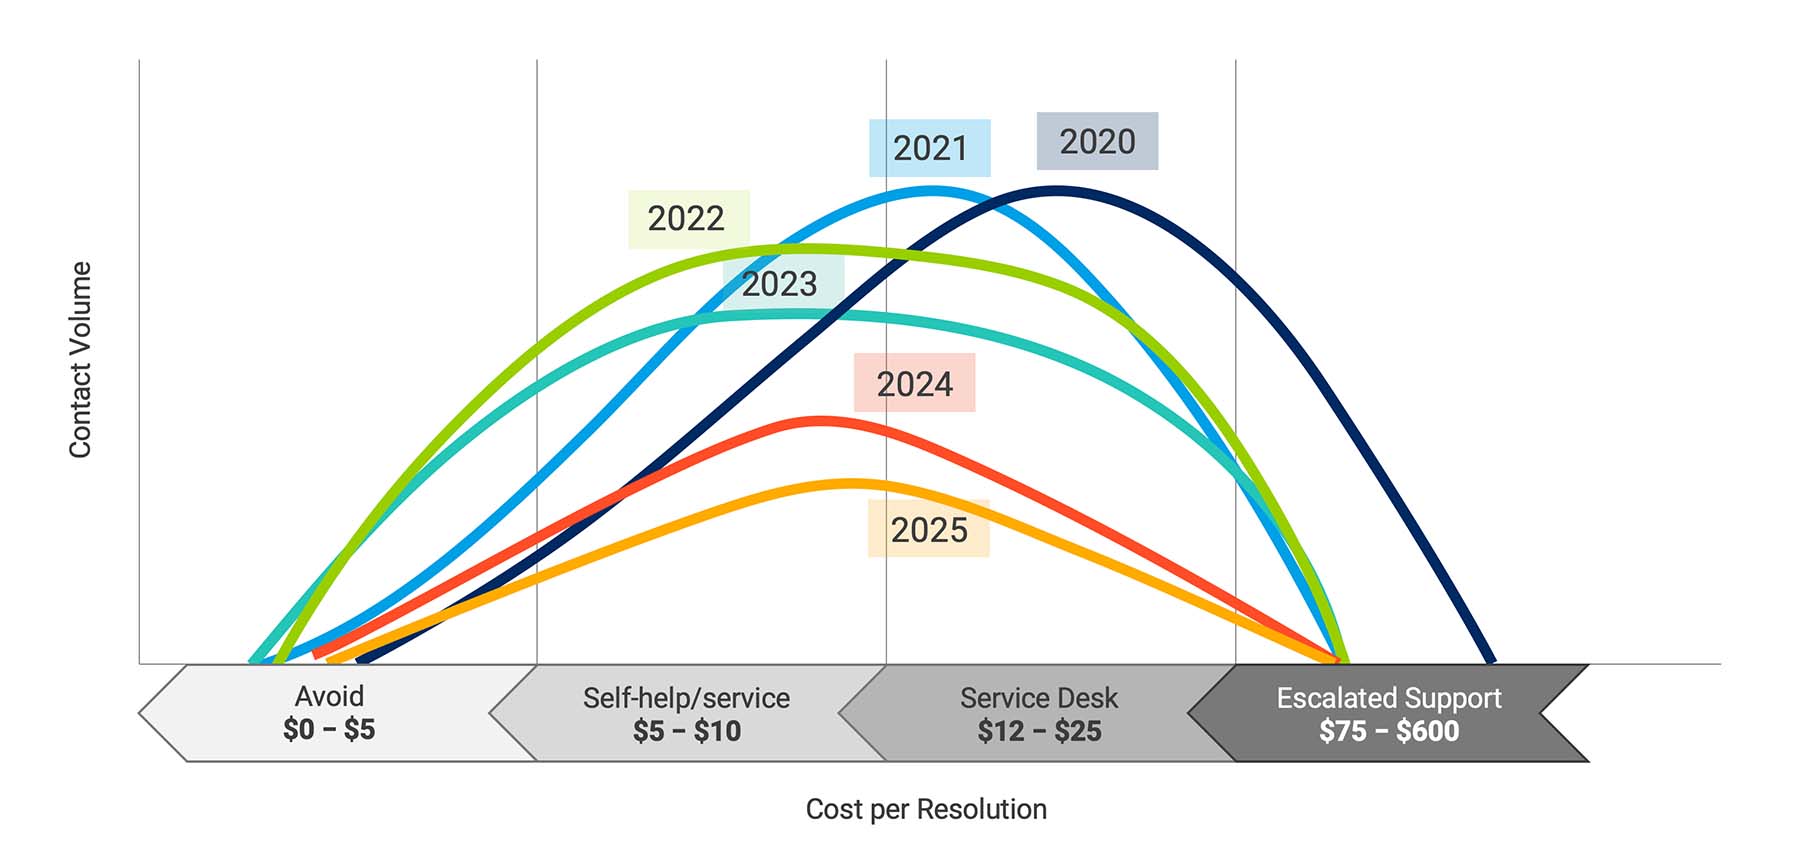
Recent gains in productivity offer important hints of what’s ahead. They also point out a few pebbles in our path. Clearly, we’d like to continue to shift left, though there will always be some complex cases that defy resolution through self-service, chatbots, AI, or even first-level support.
The goal is to reduce the number of contacts that are escalated and improve the FLR rate from the current 74% to about 80%. This means many more tickets would be resolved for $12 – $25 instead of being escalated to L2 or L3 analysts where the same solution might cost $75 – $600. The key is to provide first-level agents with the tools and training to handle some of the more sophisticated issues. Even so, FLR rates will start falling as early as 2021 as automation takes over more and more mundane tasks.
RPA and improved knowledge bases can help eliminate contacts from the service desk for simple tasks, such as password changes. That would cut the CPC for those tickets down to $0 – $10 from $12 – $25, and millennial customers often prefer to find their own solutions than to call the service desk for help.
As noted earlier, there will still be issues that require escalation, and some tickets will defy resolution at any level. For example, if someone’s laptop won’t boot, or if the service desk lacks access to a user’s session, there’s not much any analyst can do. The good news is that about 80% of cases are resolvable, and most are repeatable workflow processes that come up again and again.
The same phenomenon that allows us to push FLR from 74% to about 80% may bring the rate back down as workflow automation and AI free-up service desk resources that can be deployed elsewhere.
Part 3
The age of automation
It’s the dawn of the AI era, and the technology remains cost-prohibitive for smaller companies. Let’s say AI will reduce contact volume by about 20 percent. For a large corporation that handles 100,000 contacts a month at a $13 CPC, the ROI on a typical $1 million investment in AI would be only about four months. But for a company with just 5,000 monthly contacts and a $20 CPC, the ROI would be over four years – an eternity for any quickly evolving technology.
Over the next few years, AI prices will drop and features like virtual agents will improve. In the meantime, the most important step for most IT departments will be to integrate automation through RPA, adding functions like chatbots. For most, that will require much better user-facing knowledge bases. Prudent integration efforts can also position service desks to add AI quickly as its cost declines.
With the big shift left toward automation and more complex tasks handled by the first level, it’s increasingly obvious that we’ll also have to rebalance our reliance on metrics like FLR, response time, and abandonment rates when evaluating the service desk. CAI has developed a Shift Left Index that’s already in use by some clients.
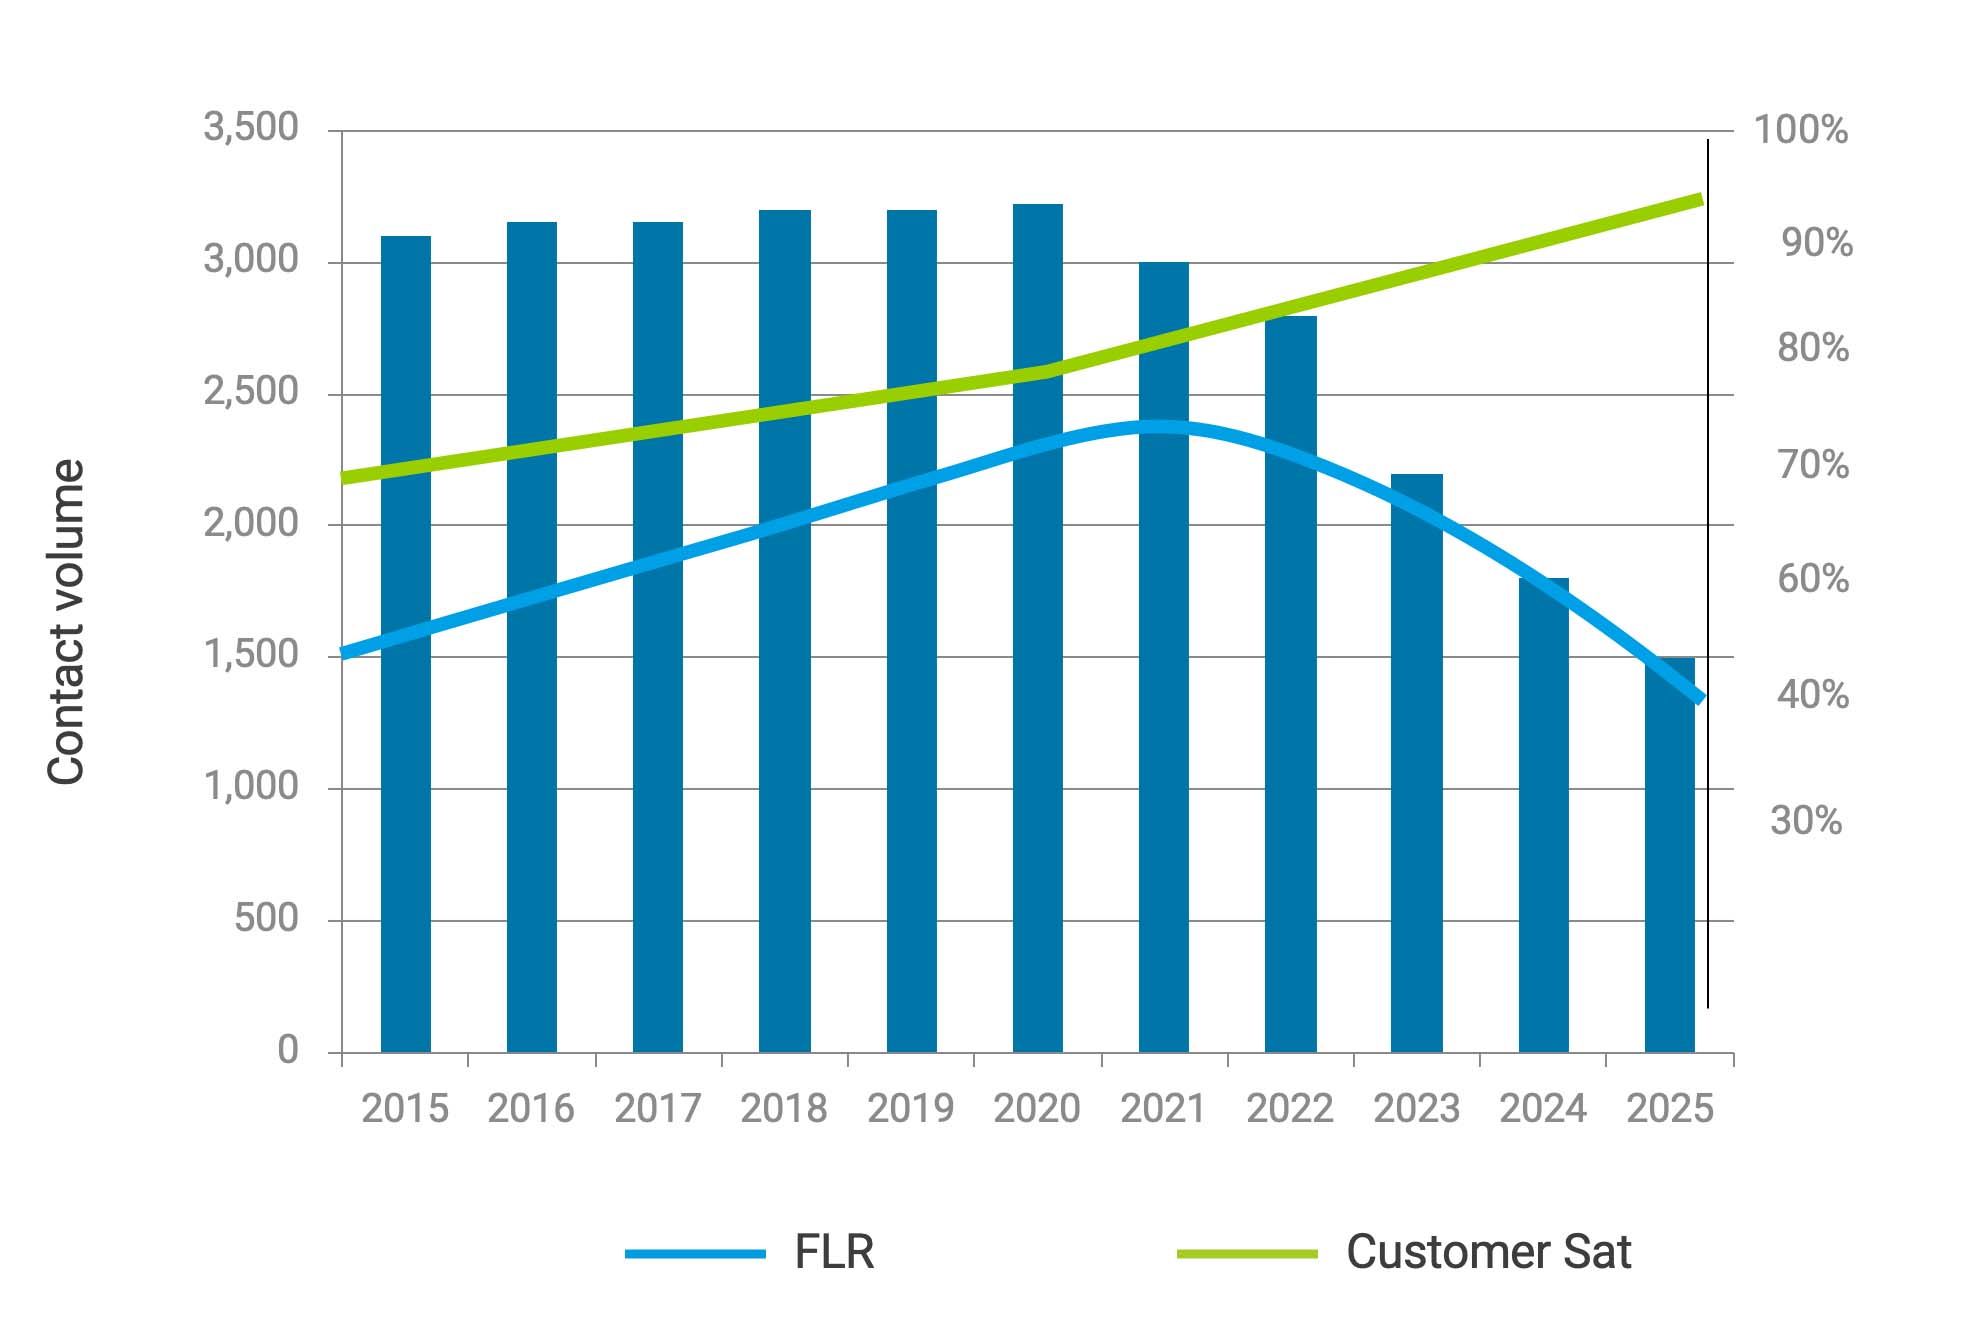
The new index blends five key data points: FLR, Knowledge Creation, Self-service Catalog Items, Contact Volume, and Customer Satisfaction. The index runs on a scale from minus 10 to plus 10 to reflect the maturity of the existing service desk as well as its productivity.
As the chart above shows we expect to see a gradual drop in FLR starting in 2021 along with a steady rise in customer satisfaction as cases are resolved more quickly – all with less cost.
Next steps
If you’d like to get more information about CAI’s Shift Left Index, or learn how to fine-tune your service desk for a better customer experience and higher ROI, visit us at www.cai.io/services/service-desk.
CAI is an Elite ServiceNow® Partner and ServiceNow managed services provider, helping clients realize the full value of the ServiceNow platform across all business operations. CAI also works with several major solutions, including BMC Remedy, HP Service Manager, and others.